NetFlow Active Analysis
NetFlow Active Analysis
Time has not been kind to network security monitoring (NSM) or to people that conduct network analysis.
Encryption has become the biggest problem when considering network analysis. You will either have no data to analyze or you need to spend resources on products that decrypt data like SSL inspection.
Other challenges include NAT, tunnels, VPN, cloud, volume, and legal.
While correct placement can fix some of these problems, in the end, legally you may not be able to capture network traffic, but all hope is not lost, I present NetFlow.
History
NetFlow is Cisco’s proprietary protocol, it was made to help network engineers easily troubleshoot their networks.
Others have created their flow standards, such as sFlow, jFlow, and NetStream.
The open standard of flow data is IPFIX (IP Flow Information Export).
Because of the heavy usage of NetFlow, we will call flow data NetFlow for the sake of simplicity.
NetFlow Structure
Each flow will have various fields, examples include:
- Timestamp
- Source & Destination IP
- Source & Destination Port
- ICMP Type Code
- TCP Flags
- Bytes Sent & Received
- Input Interface
- …
NetFlow is network traffic metadata; because of that, it is very fast and doesn’t take up any space.
Flows are commonly unidirectional but they can also be bidirectional. Every two unidirectional flows will show the complete picture.
Configuration
It is recommended that you use standard not sampled for generating flows and use protocols other than UDP for sending flows to the collector. Standard checks every packet when generating flows whereas sampled doesn’t and UDP might lose the flows in transit, in both cases, we will encounter loss of evidence.
The Hunt
One detection technique for analysts is anomaly analysis, but for it to be viable you need to understand what normal is. This is even more important with NetFlow because while there are indicators of compromise that apply to most networks, NetFlow only shows network behavior it will be the analyst’s job to detect the adversaries.
Starting with a few examples: (Contagio was used to generate the examples)
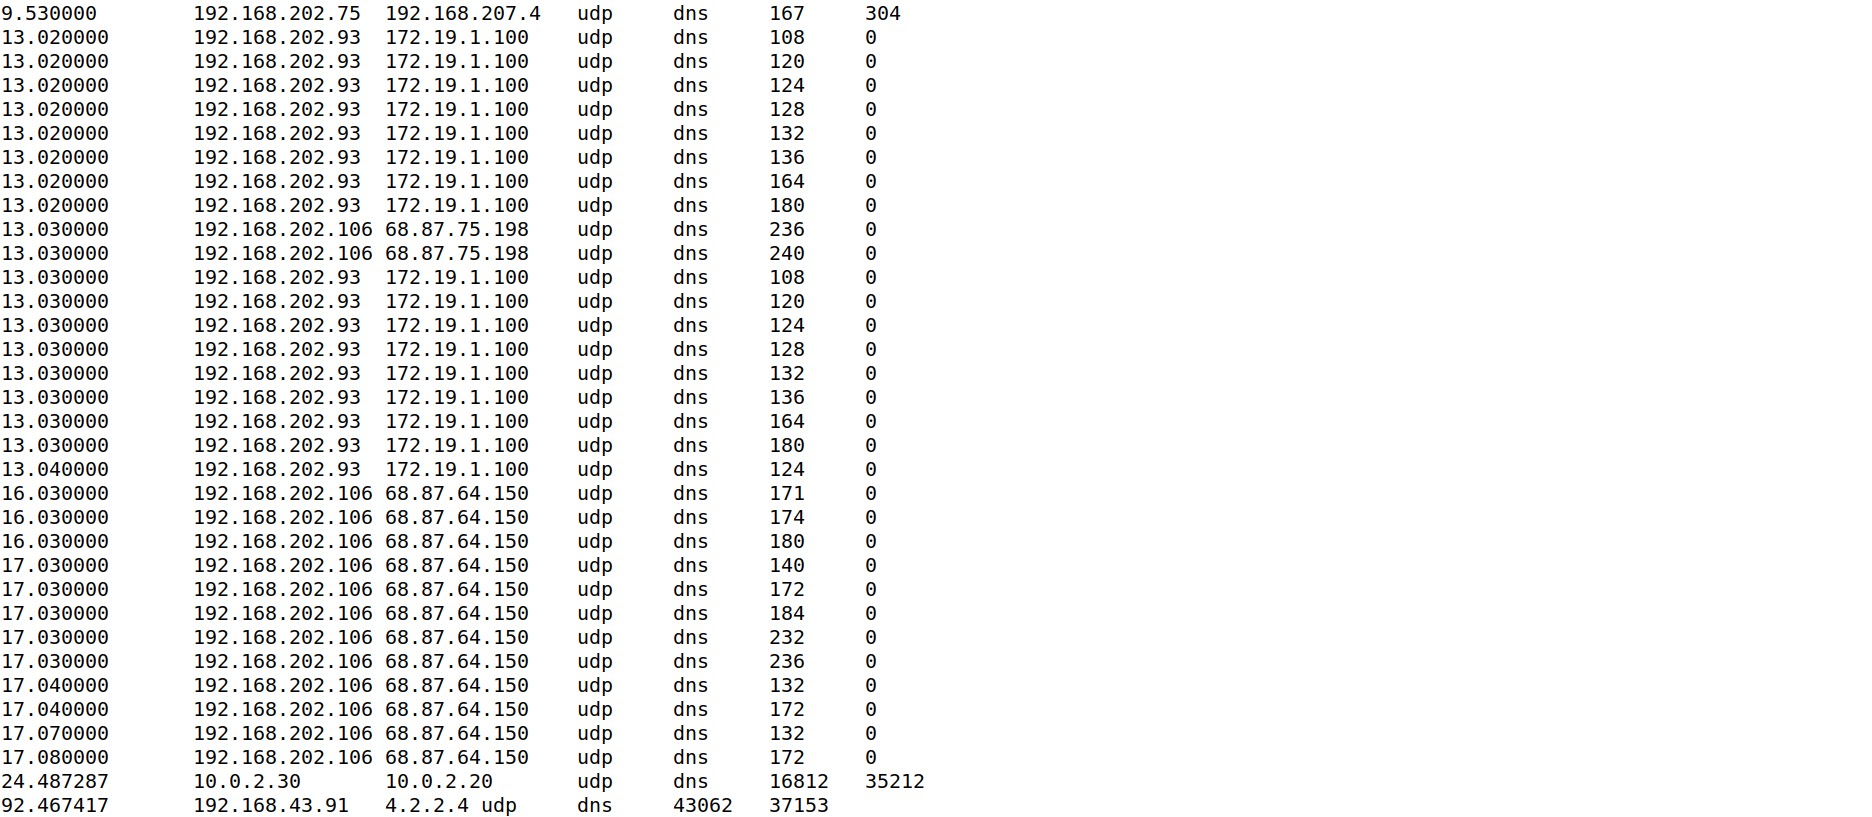
UDP port 53, small download, small upload, short duration.
Normal DNS.
cat conn.log | zeek-cut duration id.orig_h id.resp_h proto service orig_bytes resp_bytes | sort -u | sort -n

UDP port 53, large/medium download, large/medium upload, long duration.
DNS tunnel, DNS C2.
cat conn.log | zeek-cut duration id.orig_h id.resp_h proto service orig_bytes resp_bytes | sort -u | sort -n
TCP port 80/443, medium download, small upload, short duration.
Normal HTTP download.
TCP port 443, large download, large upload, long duration.
TLS VPN.
ICMP, small download, small upload, short duration.
Normal ICMP.
ICMP, large download, large upload, long duration.
ICMP Tunnel.
cat conn.log | zeek-cut duration id.orig_h id.resp_h proto orig_bytes resp_bytes

The benefit of IDSs like Suricata and Zeek is that they give us a simple log file with NetFlow information that we can parse on the command line and hunt for anomalies.
In an enterprise, this is not feasible. You need to gather all the information in a central location for faster and easier processing.
As you might have noticed some fields can be more useful than others. Looking for extremes is a simple way to detect less stealthy adversaries, a comparative analysis of similar systems is helpful, and knowing what normal looks like can help in detecting abnormal activity.
Here I will show you ELK bucket configurations so you could be able to centralize your NetFlow threat hunts. It is important to add that there are different ways of doing this.
Outbound analysis is a great way to detect C2 channels and policy violations.
When looking at outbound traffic volume can easily indicate exfiltration.
Another interesting detection is upload to download ratio, users normally download more than they upload, and even with small volumes seeing 10MB of upload and 1MB download should be investigated.
You can visualize most downloaded and uploaded bytes based on IP using the vertical bar with the configuration below:
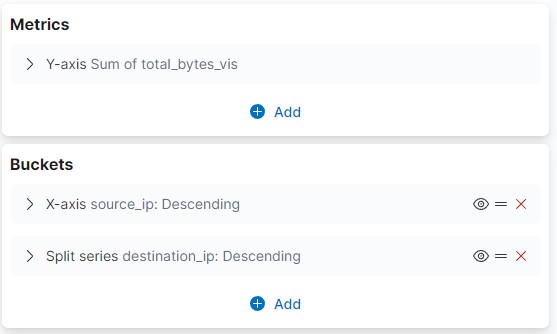
You can also create one for upload and another for download.
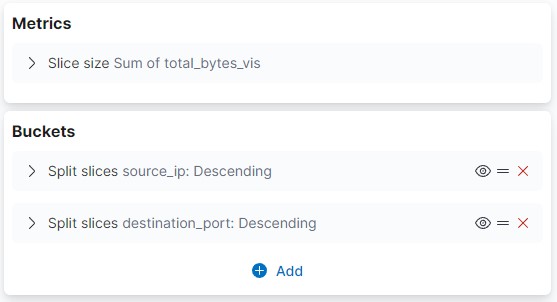
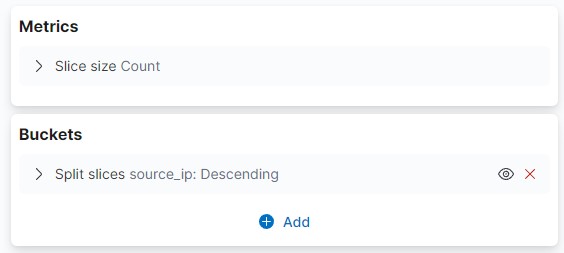
Volume can also be visualized based on ports using the pie chart with the configuration below:
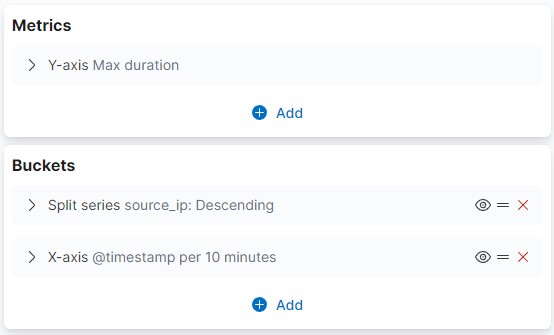
Adversaries will use C2 channels to control the systems they have compromised, this may result in connections with long durations.
You can visualize this with the line chart and configuration below:
The number of connections is another indicator, you can either look at the extremes or do comparative analysis.
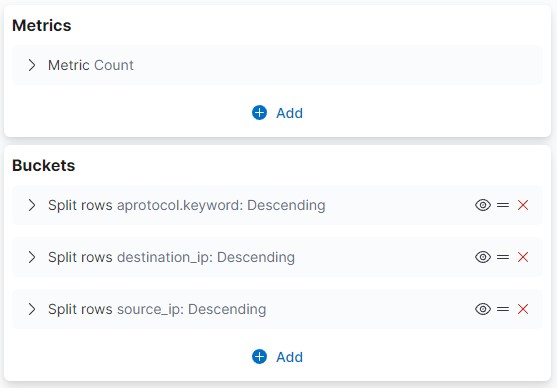
To complete your dashboard you can add several data tables to easily correlate data.
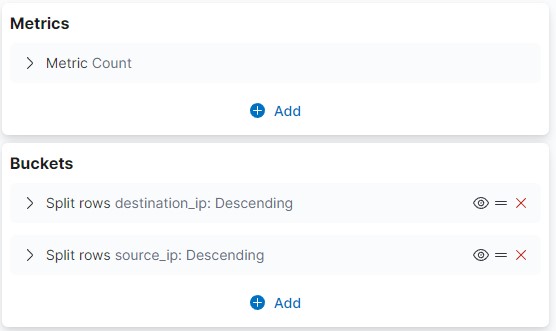
With the correct visibility, you can get access to the workstation-to-workstation traffic which can help you detect lateral movement.
To check for lateral movement, filter on internal to internal IP addresses.
Conclusion
By creating a central detection point you can enable your analysts and threat hunters to hunt the adversaries in your environment.
Using NetFlow you can check for IPs, ports, and volume, when abnormal activity is detected you can conduct further analysis using other data sources.
It is important to be skeptical but never rush to conclusions, use NetFlow as part of your initial analysis and then conduct further investigations.